Introduction to Data and Data Science
Introduction
Data Science is a field of study and practice that aims to extract knowledge and information from data. Scientific methods, processes, statistics, mathematics and domain knowledge is used to do so, of course using computational power. Although the term was coined and gained popularity in recent years, one may be surprised to know that the concepts used in data science are centuries old. It is natural then to ask why did this become so popular today.
It gained popularity because of two things. One, we started accumulating data, like never before. More data means possibility to extract more information. And more information helps in decision making. And we want to grasp this opportunity.
However, this vast amount of data in itself did not cause the boom. More data means more calculations. When we talk about thousands of rows of data, it is beyond the capability of human to perform the necessary calculations manually. And when talk about millions or billions of rows, it would have taken several days for a machine (computer) to do it, few decades back. Today, however, the computational power has increased exponentially. And this, combined with the large amount of data, made sure that we have the oil (data) and the rig (computational power).
About data
Data, as mentioned in the last section, is the most essential element in data science. They provide information or characteristics of some event, someone or something. It is gathered through observation, monitoring etc. One way to put it is data stores information about what, when, where and who. And analysts and data scientists use it find why and how.
Types of data
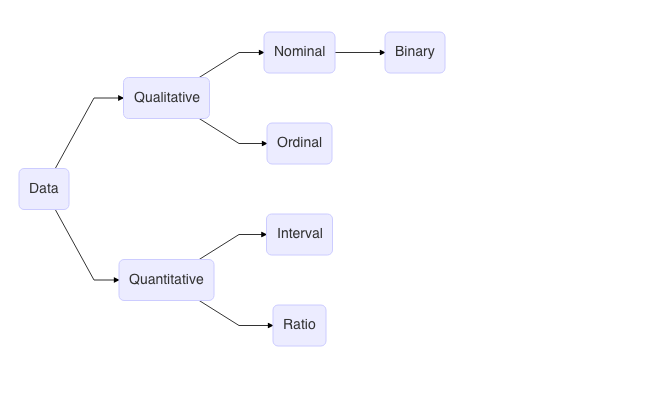
Data can be qualitative or quantitative. Qualitative means non-numeric and quantitative means numeric. Quantitative data can be further divided into discrete and continuous.
Discrete indicate whole numbers. For e.g. 1 apple, 25 people and so on. When we talk about 1 apple, it is exactly one. And it does not become 0.8 or 1.25 or even 2 in time. Continuous on the other hand are not whole numbers. weight of the 1 apple discussed above can be 100 g. This 100 g is never exactly 100 g. It is, let’s say, between 99 g and 101 g or 99.9 g and 100.1 g etc. There is a tolerance involved. Similarly, weight of a person or speed of a vehicle are also examples of continuous variables. Both of these change with time.
There is another way to classify data, based on scale of measurement i.e. how much sense does it make to apply arithmetic on the data. Nominal data is a variant of categorical / qualitative data where all qualities of the variable have equal importance. For e.g. gender (M/F/MTF/FTM/O) or place (Mumbai, New York, Singapore, London, Tokyo) or response (Yes, No). A variant of nominal data is binary where binary responses are involved (yes/No, 0/1 etc.). Ordering of nominal variable does not make sense (other than alphabetically, perhaps). Ordinal data is also categorical data. But the qualities of the variable has unequal importance. For e.g. small, medium, big or lower, middle, upper etc. Ordering of ordinal variable makes sense. Interval data is a numeric data, mostly generated from rating scales, for e.g., in surveys. For e.g. Linkert Scale where one rates in terms of say, strongly agree, agree, neutral, disagree, strongly disagree. Each of these have an underlying value. So, strongly agree could be 1, agree could be 2 and so on. One important aspect in there is no zero origin. Hence, one cannot say in this kind of scale, 2 is twice more important than 1. Ratio data indicate real numbers. All real numbers are ratio data. It has all the properties of numbers including zero origin.
You may have a look at the video as well.