Sampling and Sampling Distribution
Sample
A sample is a subset of a population. Most of the time it is too expensive or impossible to collect population data. The whole idea of inferential statistics (which later evolved to machine learning and AI) revolves around estimation of population parameters by studying parameters of samples. Samples and sample distribution are the last two of the four wheels on which inferential statistics (and machine learning and AI) runs. The other two are descriptive statistics and probability which we have already covered.
A sample must be representative of its population for analysis to be robust. Sampling can be divided into two types; Random and non-random. Non random sampling means that the samples were not selected a random. Samples not selected at random are not suitable for inferential statistical analysis and we will not focus on those.
Randomly selected samples are suitable for statistical analysis. The selection is purely random. Suppose you want to understand the some parameter related to Indian population. You may randomly select some Indian citizen to run the analysis. It is more like a lottery or picking up numbers from a hat. This is called simple random sampling.
Another way of sampling could be dividing the sampling frame into blocks. Using the last example, you may first select x number of people at random. You may then divide them into some groups. Then select one person at random from the first group only. If that person is nth in the sample, you keep on selecting the nth from each group. This is called systematic random sampling.
Stratified random sampling is used when population is assumed to be non-homogeneous or heterogeneous with respect to parameter under consideration. Groups are created where each group is assumed to be heterogeneous. For example if we want to analyse the goals scored per match by football players, we may like to divide them by the level in which they play or the positions in which they play. Comparison of goals scored by a goal keeper and a striker may not make sense.
Cluster random sampling is used when target groups form natural groups. For example, if you want to analyze gender diversity in automobile manufacturers in US, you may first randomly select a few companies. And then measure the parameters in those companies.
**Non-probability sampling are suitable only for exploratory analysis. Probability sampling is suitable for both exploratory and inferential statistics.
Sampling distribution
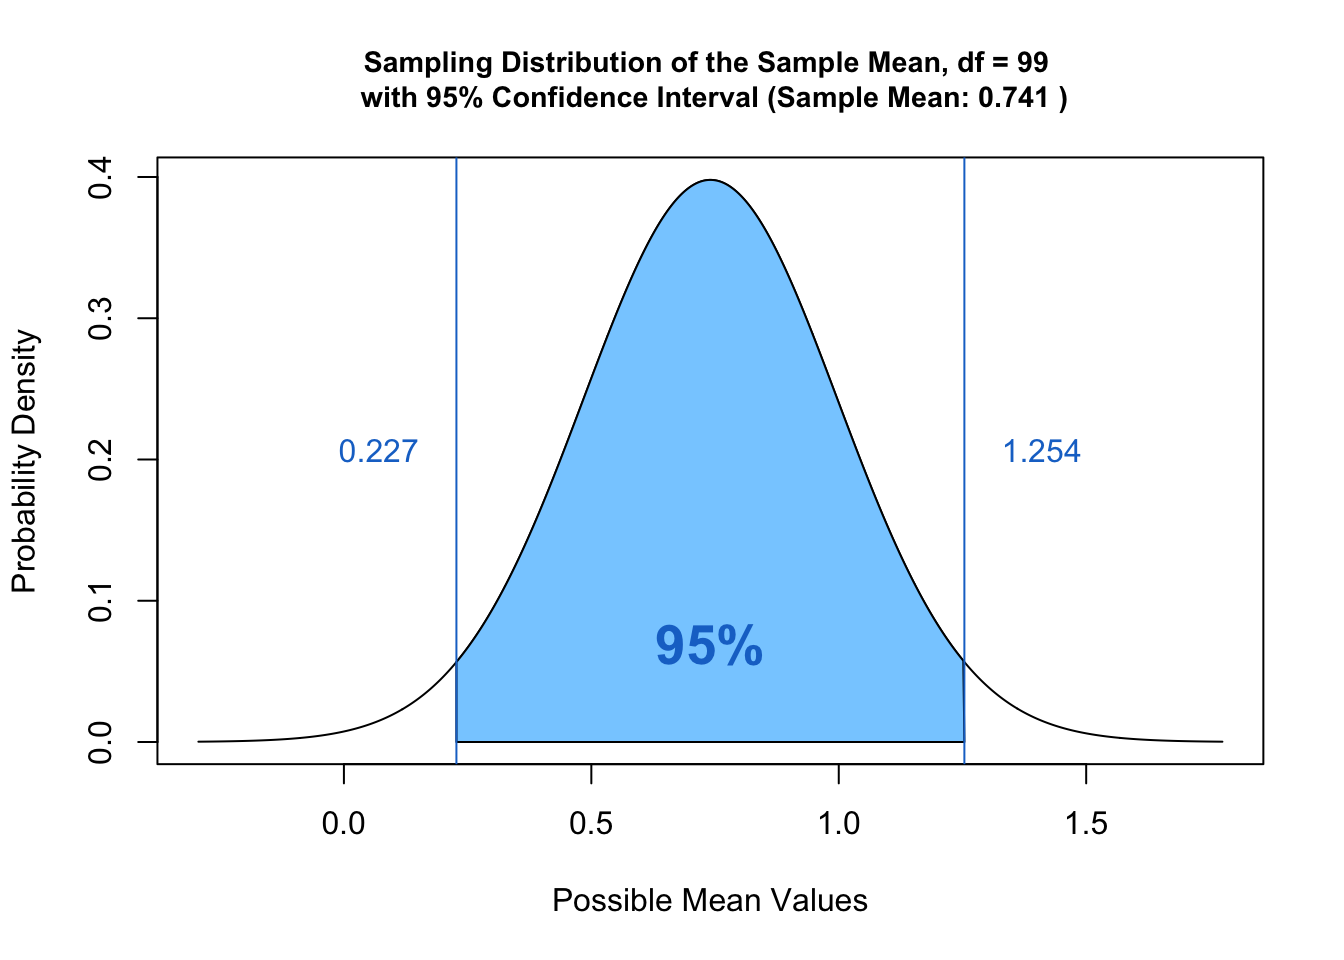
When we measure parameter of a sample with the aim to estimate the same parameter of the population, one of the question that naturally arises is the question of accuracy. For example, let us assume that we were to measure the average weight of all students in a school and we took a sample to calculate this. If the sample average weight is x, the question is how accurately does it reflect the average weight of the population (all the students). Or, how confident are we about it.Or, how close of far is it from the population parameter. Sampling distribution is what helps us answer these questions. It shows the relationship between sample statistic and the population statistic.
The following is established and considered for central tendency measures (single mean, single proportion, difference between means and difference between proportions) for normal distribution.
- 68.3 % of all sample parameter will lie between one standard error (standard deviation of the sample)
- 95.5 % of the time it will lie between two standard errors and
- 99.7 % of the time it will lie between three standard errors
The exact probability is calculated using z-stat, which specifies the position of the sample parameter in the distribution of all possible means (from different samples of the same population) of the population.
z-stat is calculated using different established formulas for each central tendency. Modern software like R, Python excel etc.
have inbuilt functions to calculate the z-stat. z-stat and some other versions of are basis for hypothesis testing and further.
I strongly recommend you to go through the following video to understand what or which position does z-stat show.
To check how sampling is done in R, you may like to view this video.